Purpose
Client wanted to create partner personas in order to have an experience driven portfolio and make decisions based on partner needs.
Challenges
- Scheduling interviews and conducting several a day in order to meet our deadline
- Manually amalgamating the transcribed interviews into clear data points
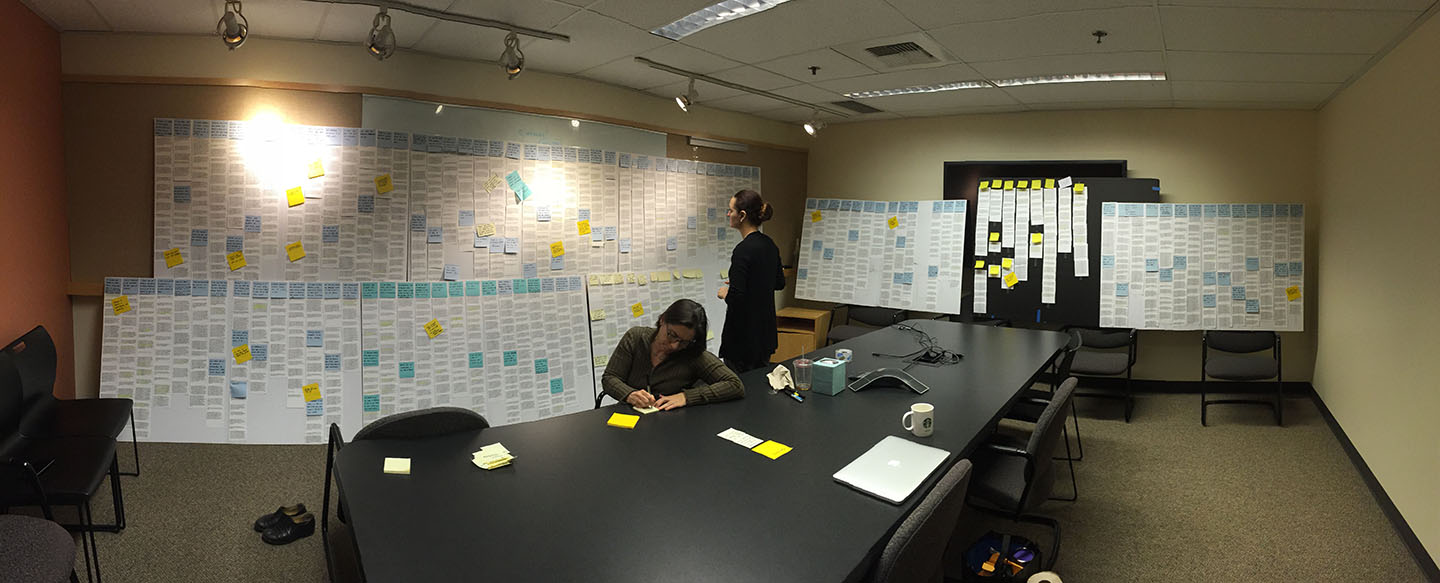
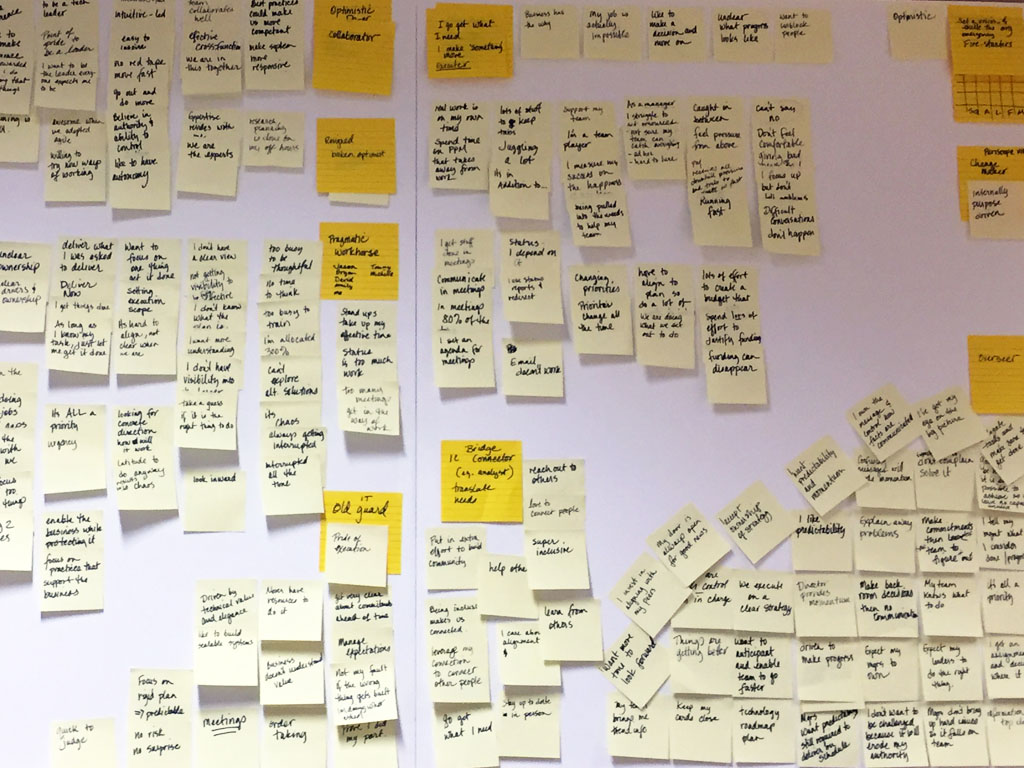
- Affinity mapping 5000 data points in 7 days with a team of four
Project & Process
Duration - 4-week engagement
Research and Persona Design - user interviews, affinity mapping and data analysis
Team - I was part of a team of two who conducted the research, and a team of four who mapped the findings into the final personas.
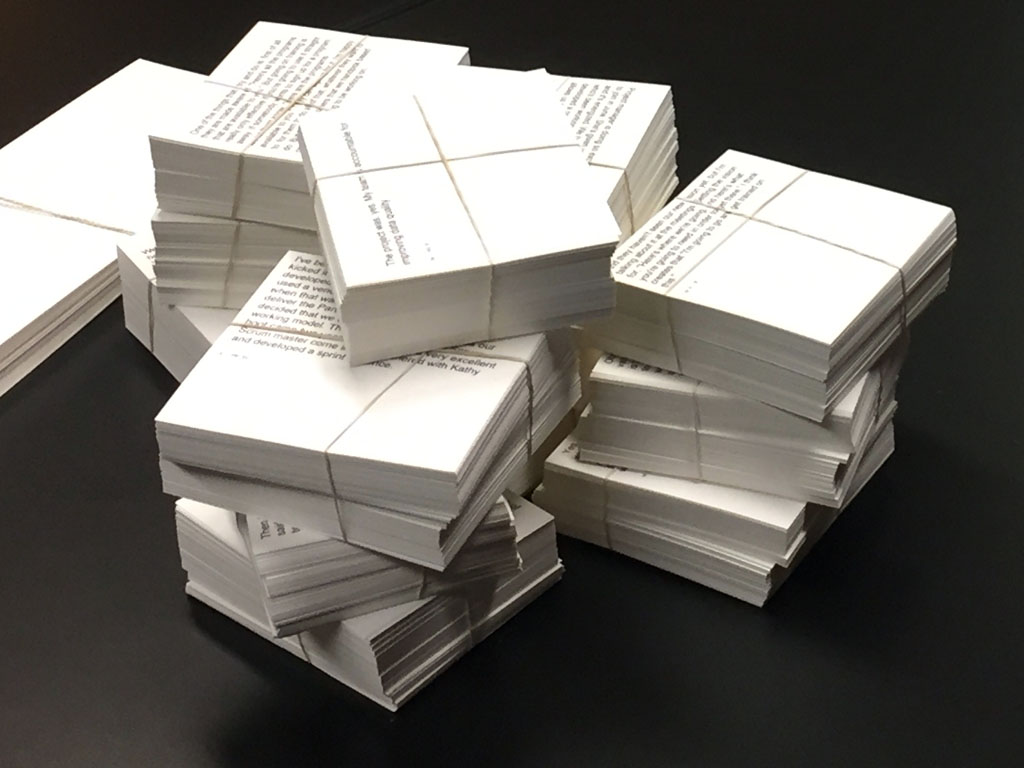
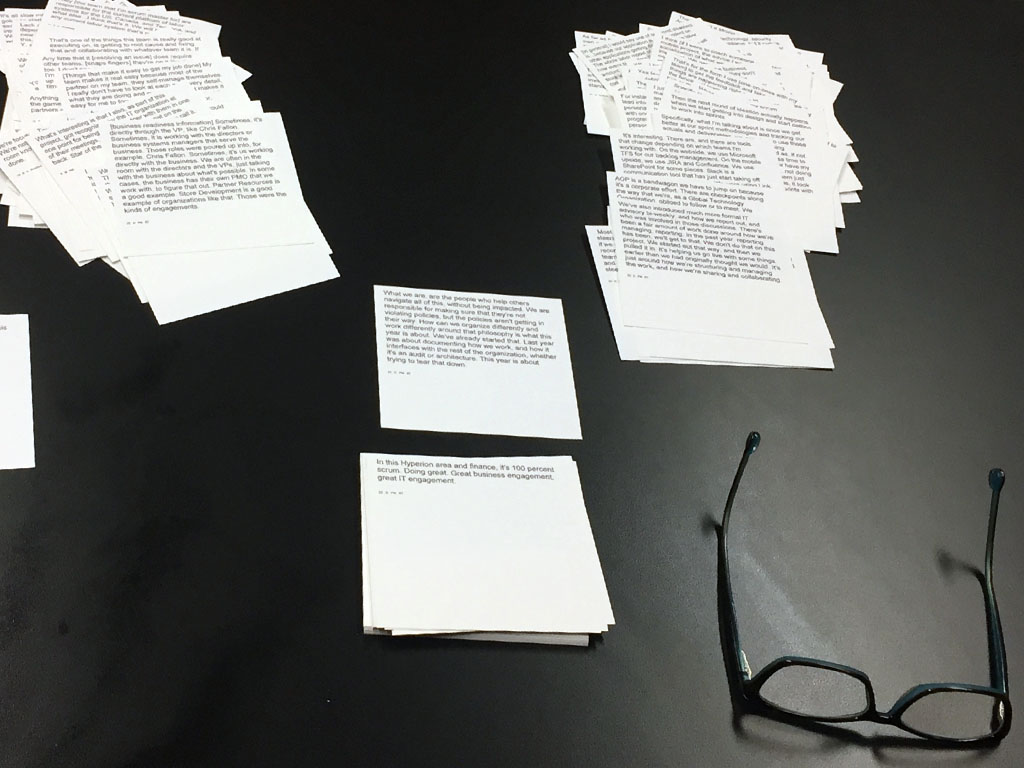
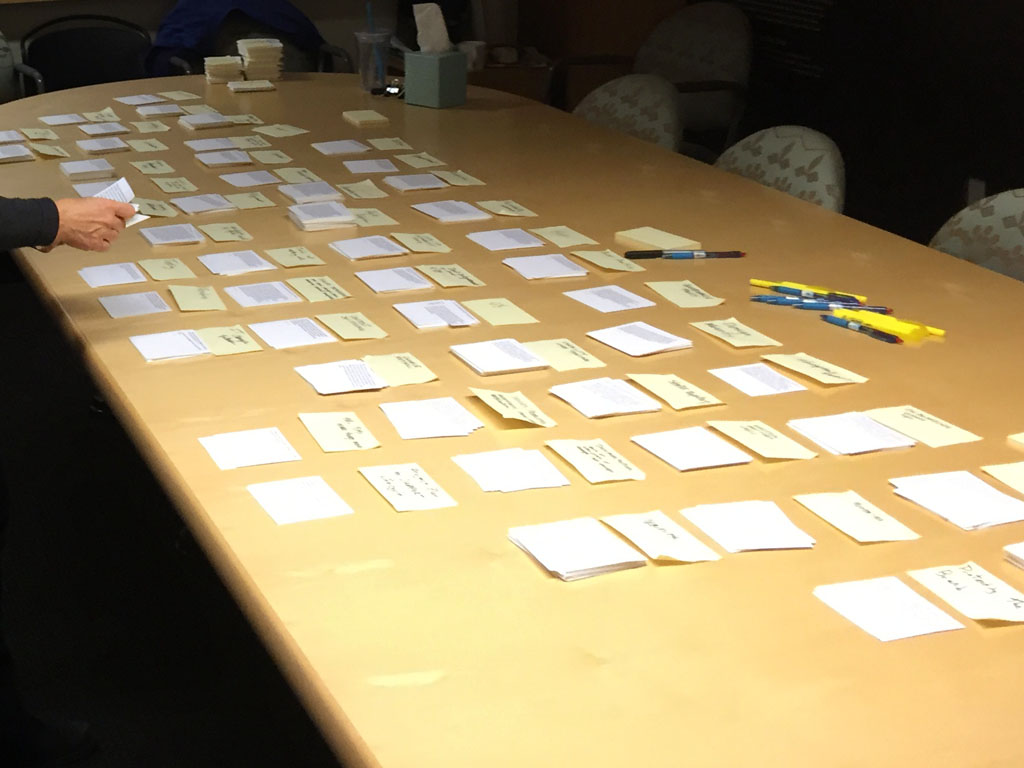
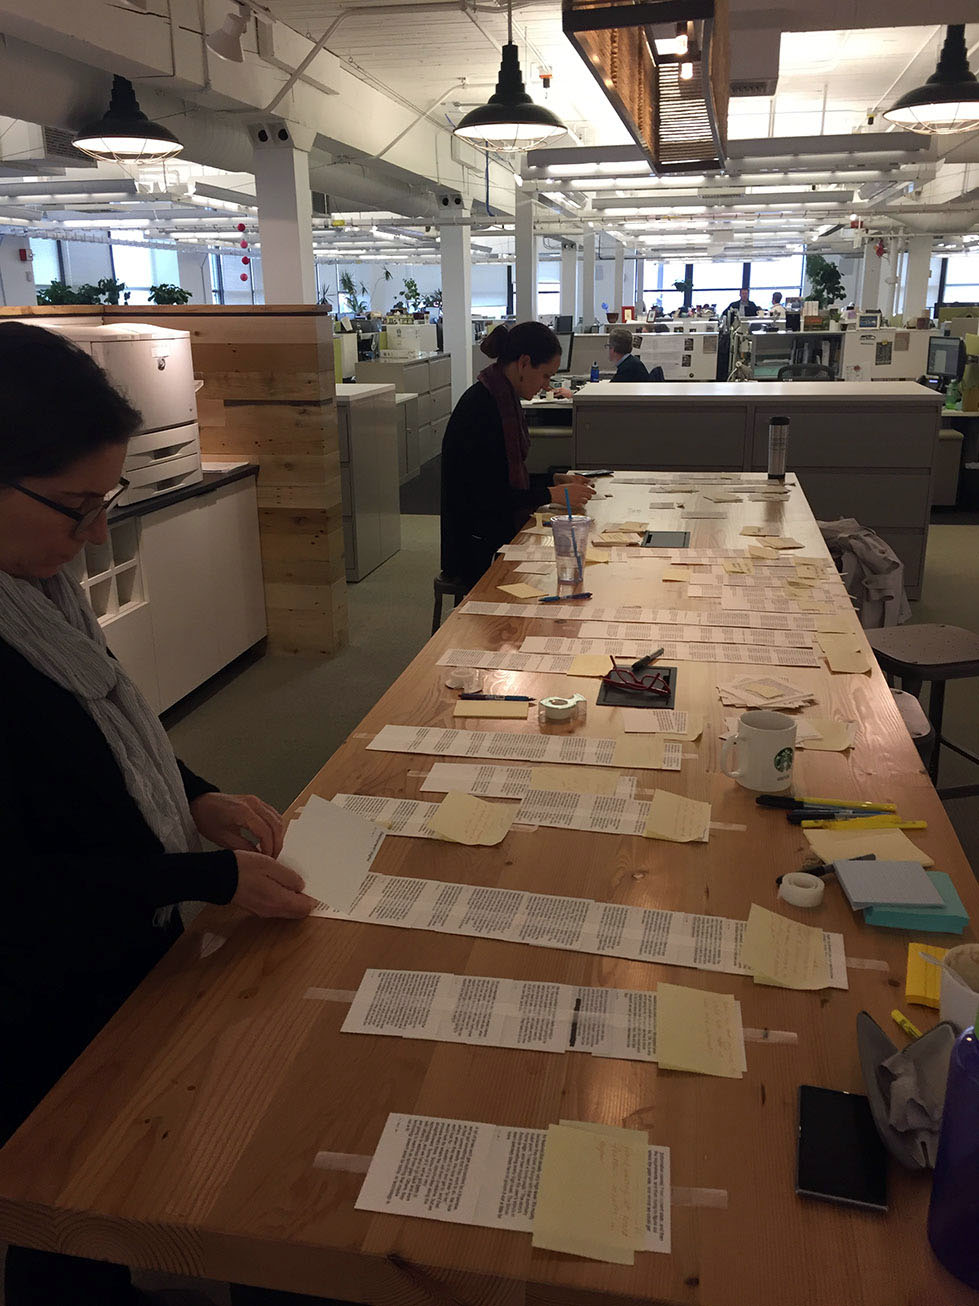
We interviewed 25 people across the IT department in different roles. After the interviews were transcribed, I went through each interview creating cohesive data points, which were then printed onto 3x5 cards.
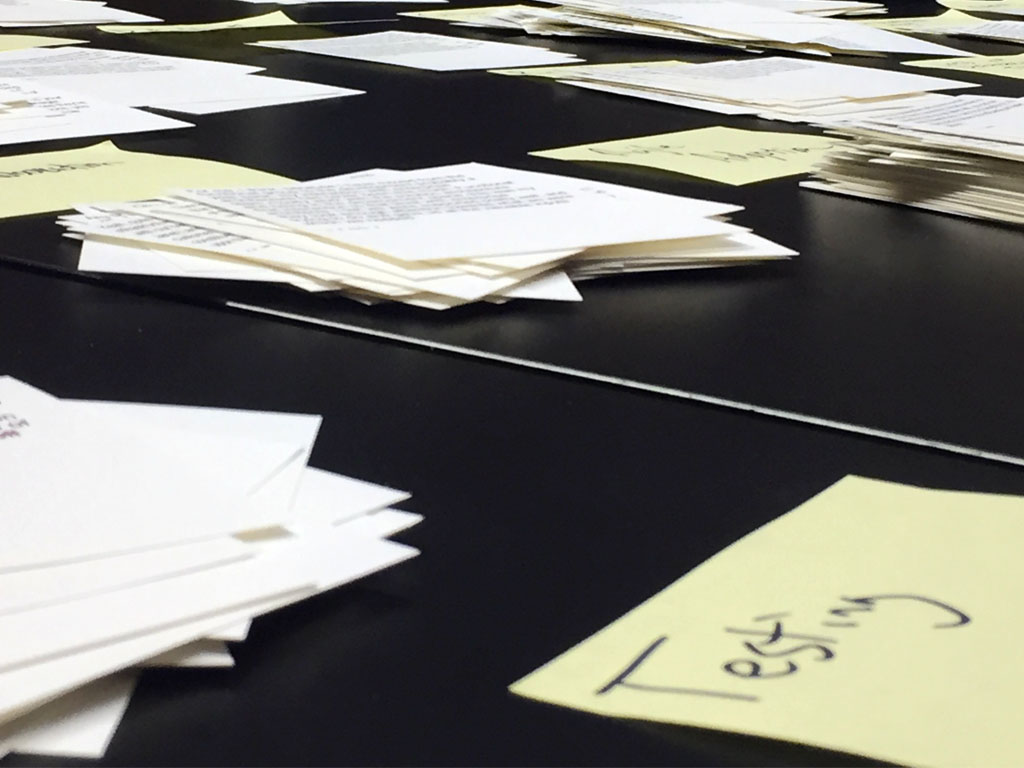
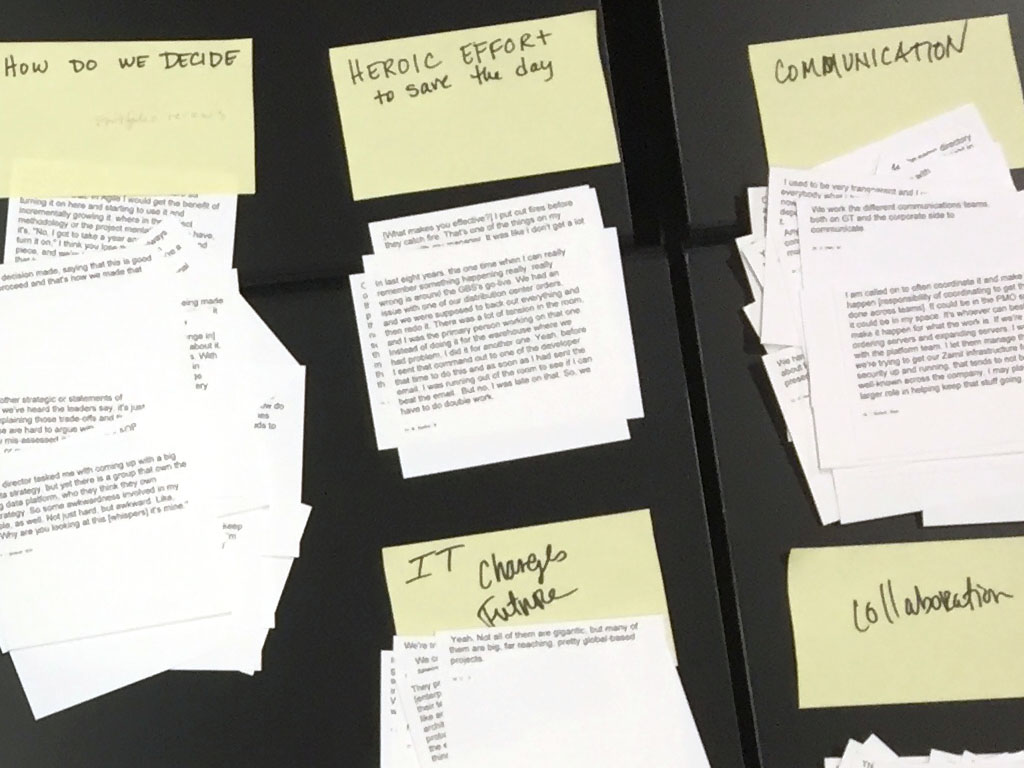
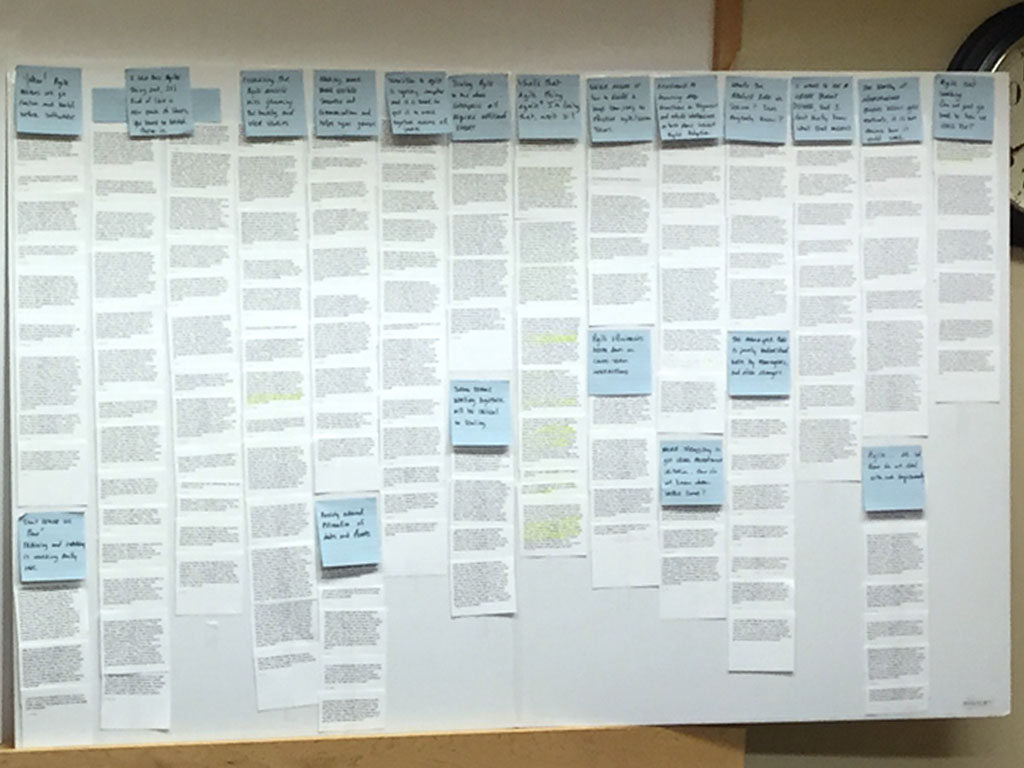
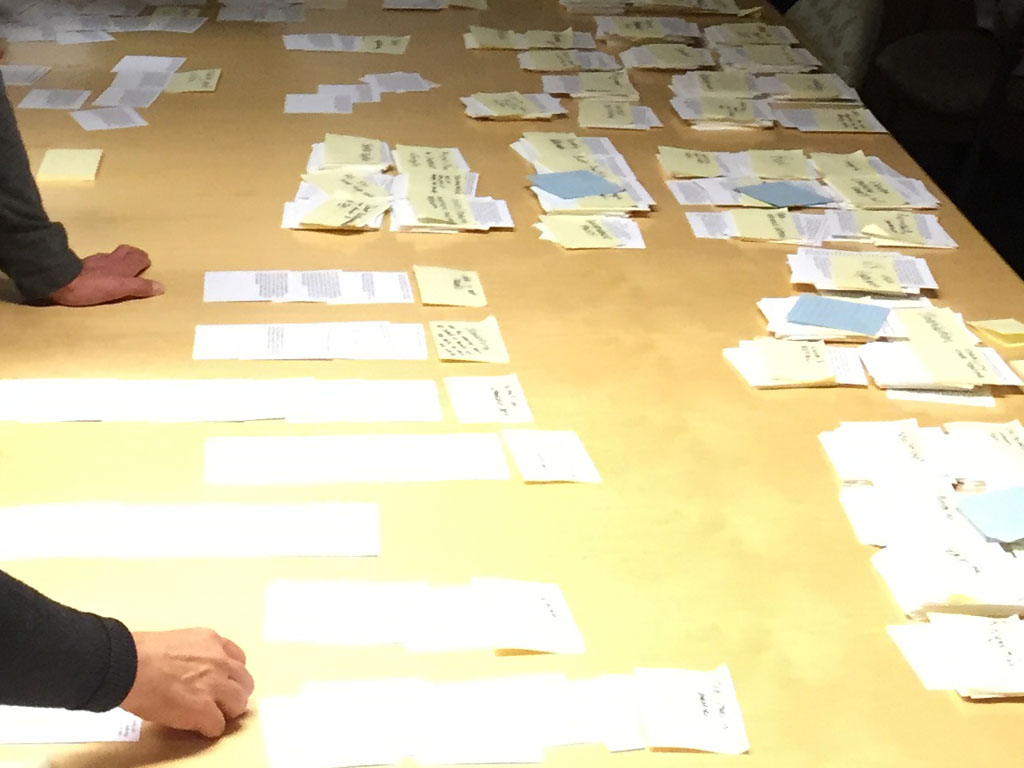
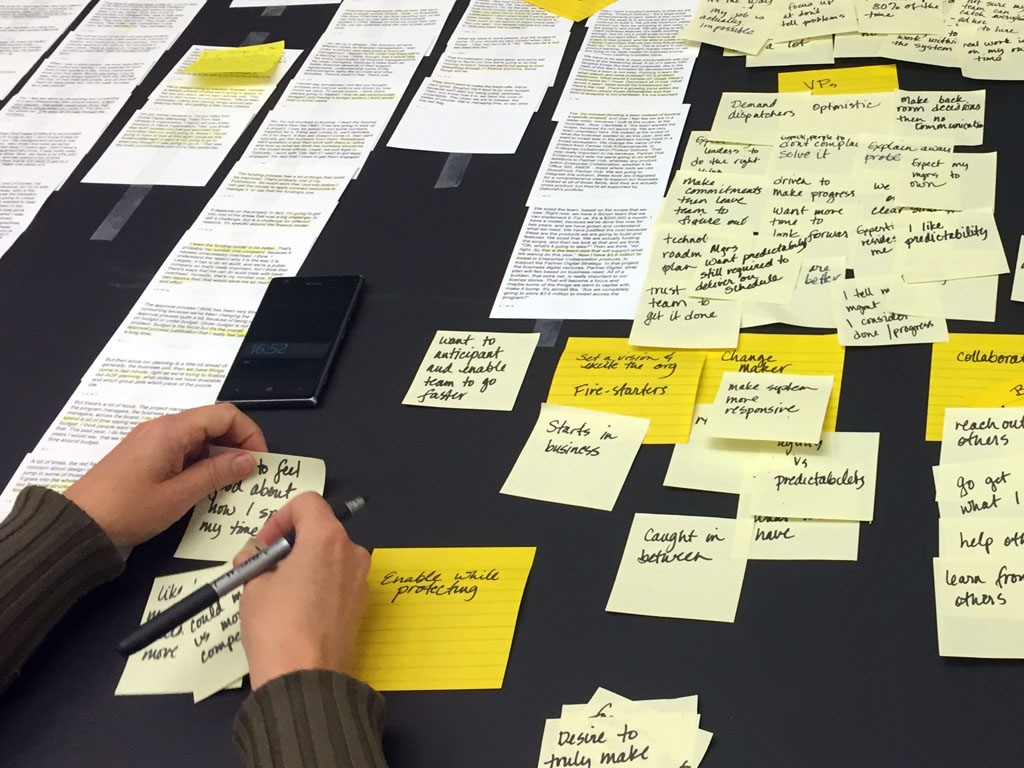
Affinity mapping 5000 data points - lots of water, coffee, reading, thinking, and sticky notes.
Over the span of 7 days, our team of four used the affinity mapping process to distill the data (5000 data points) into groups of specific characteristics, needs and problem statements. These were further coalesced to identify distinct personas.
Outcome
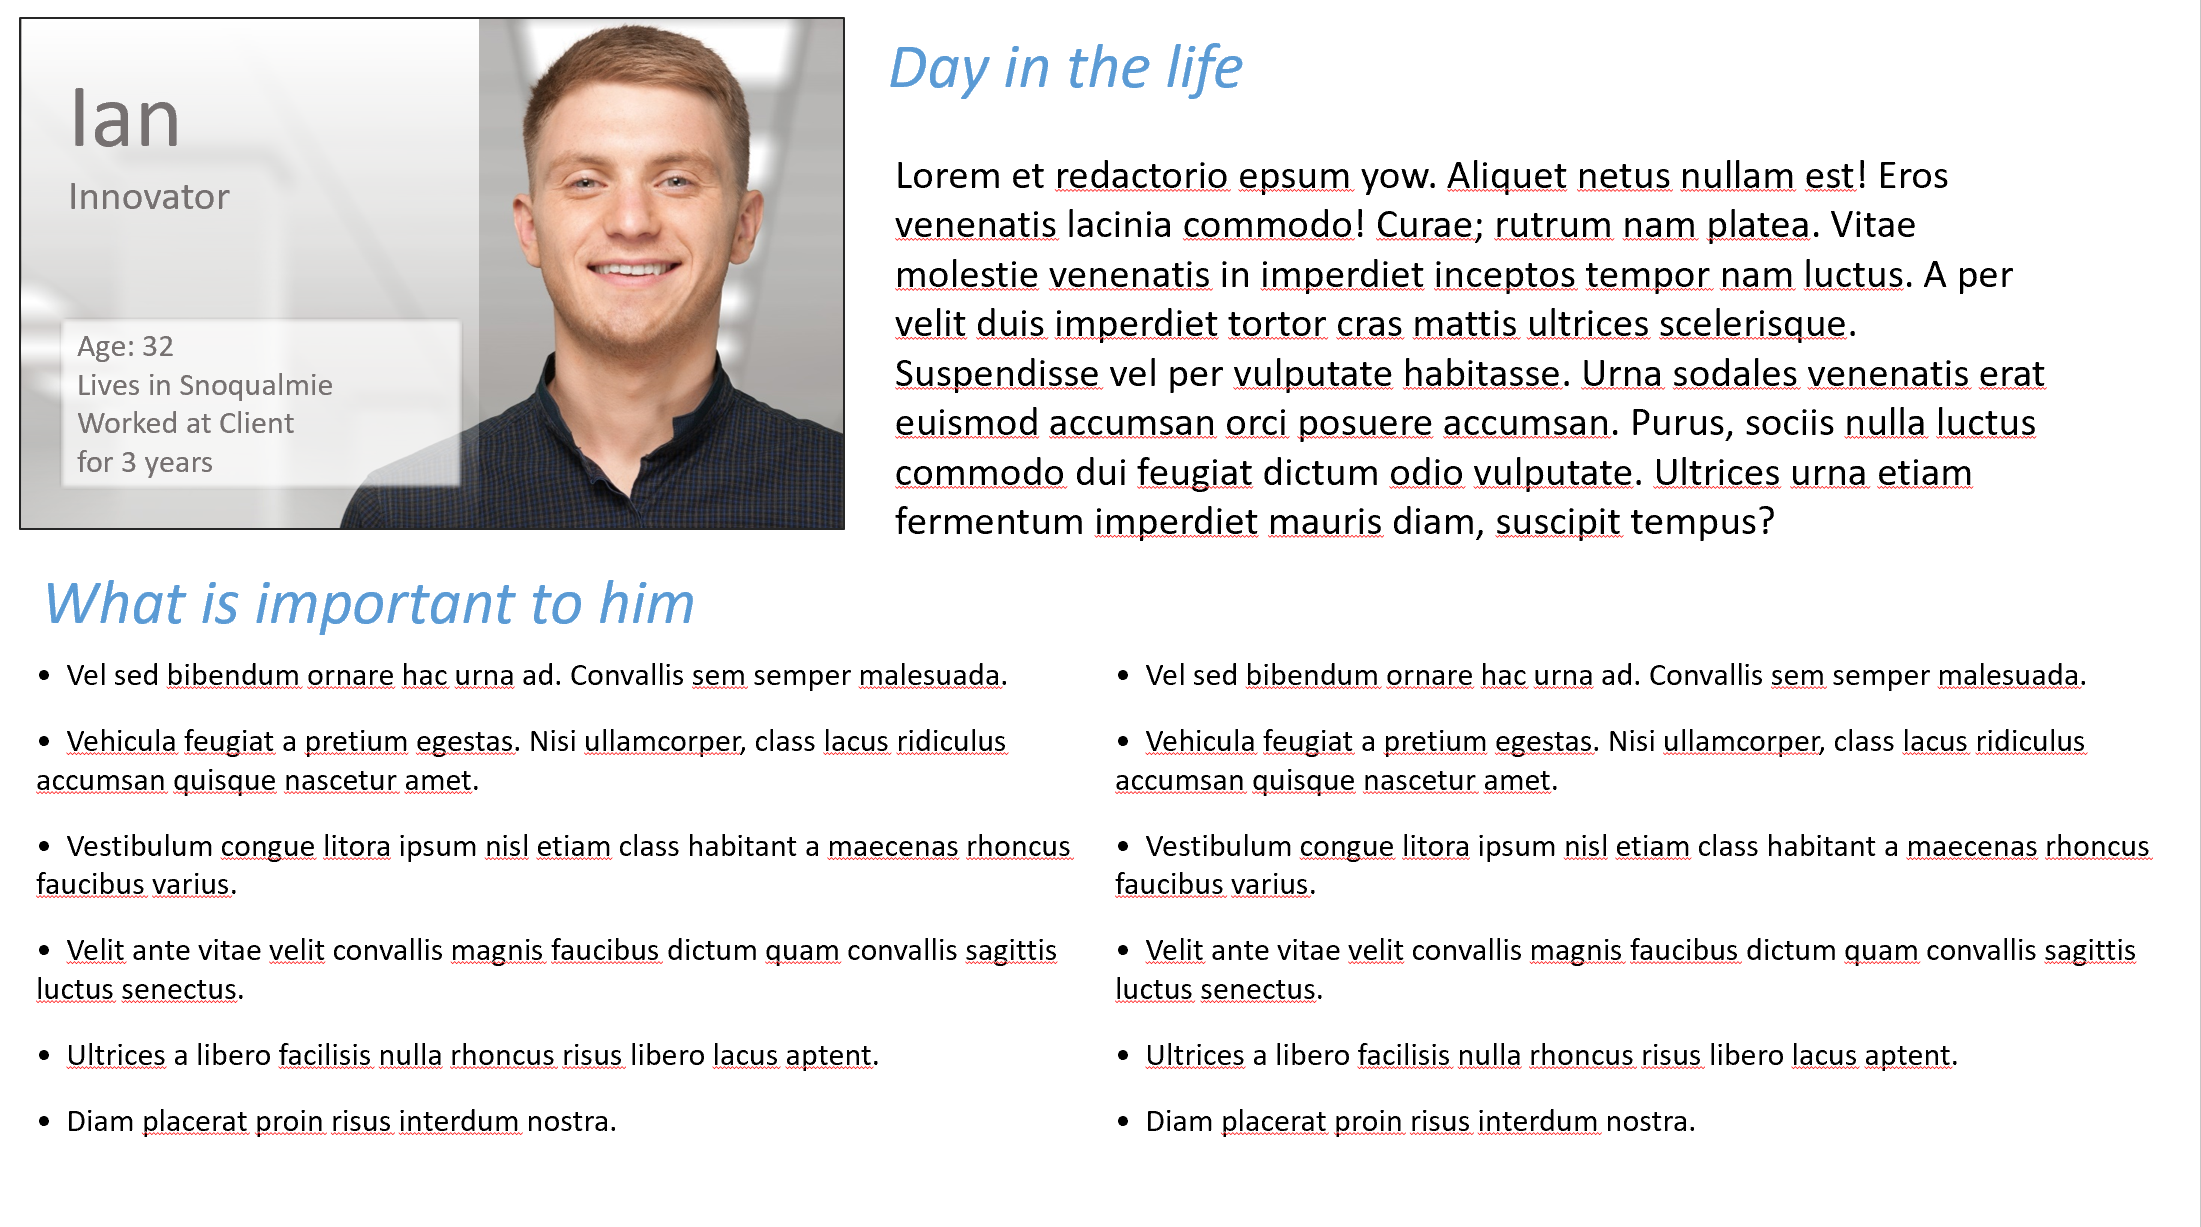
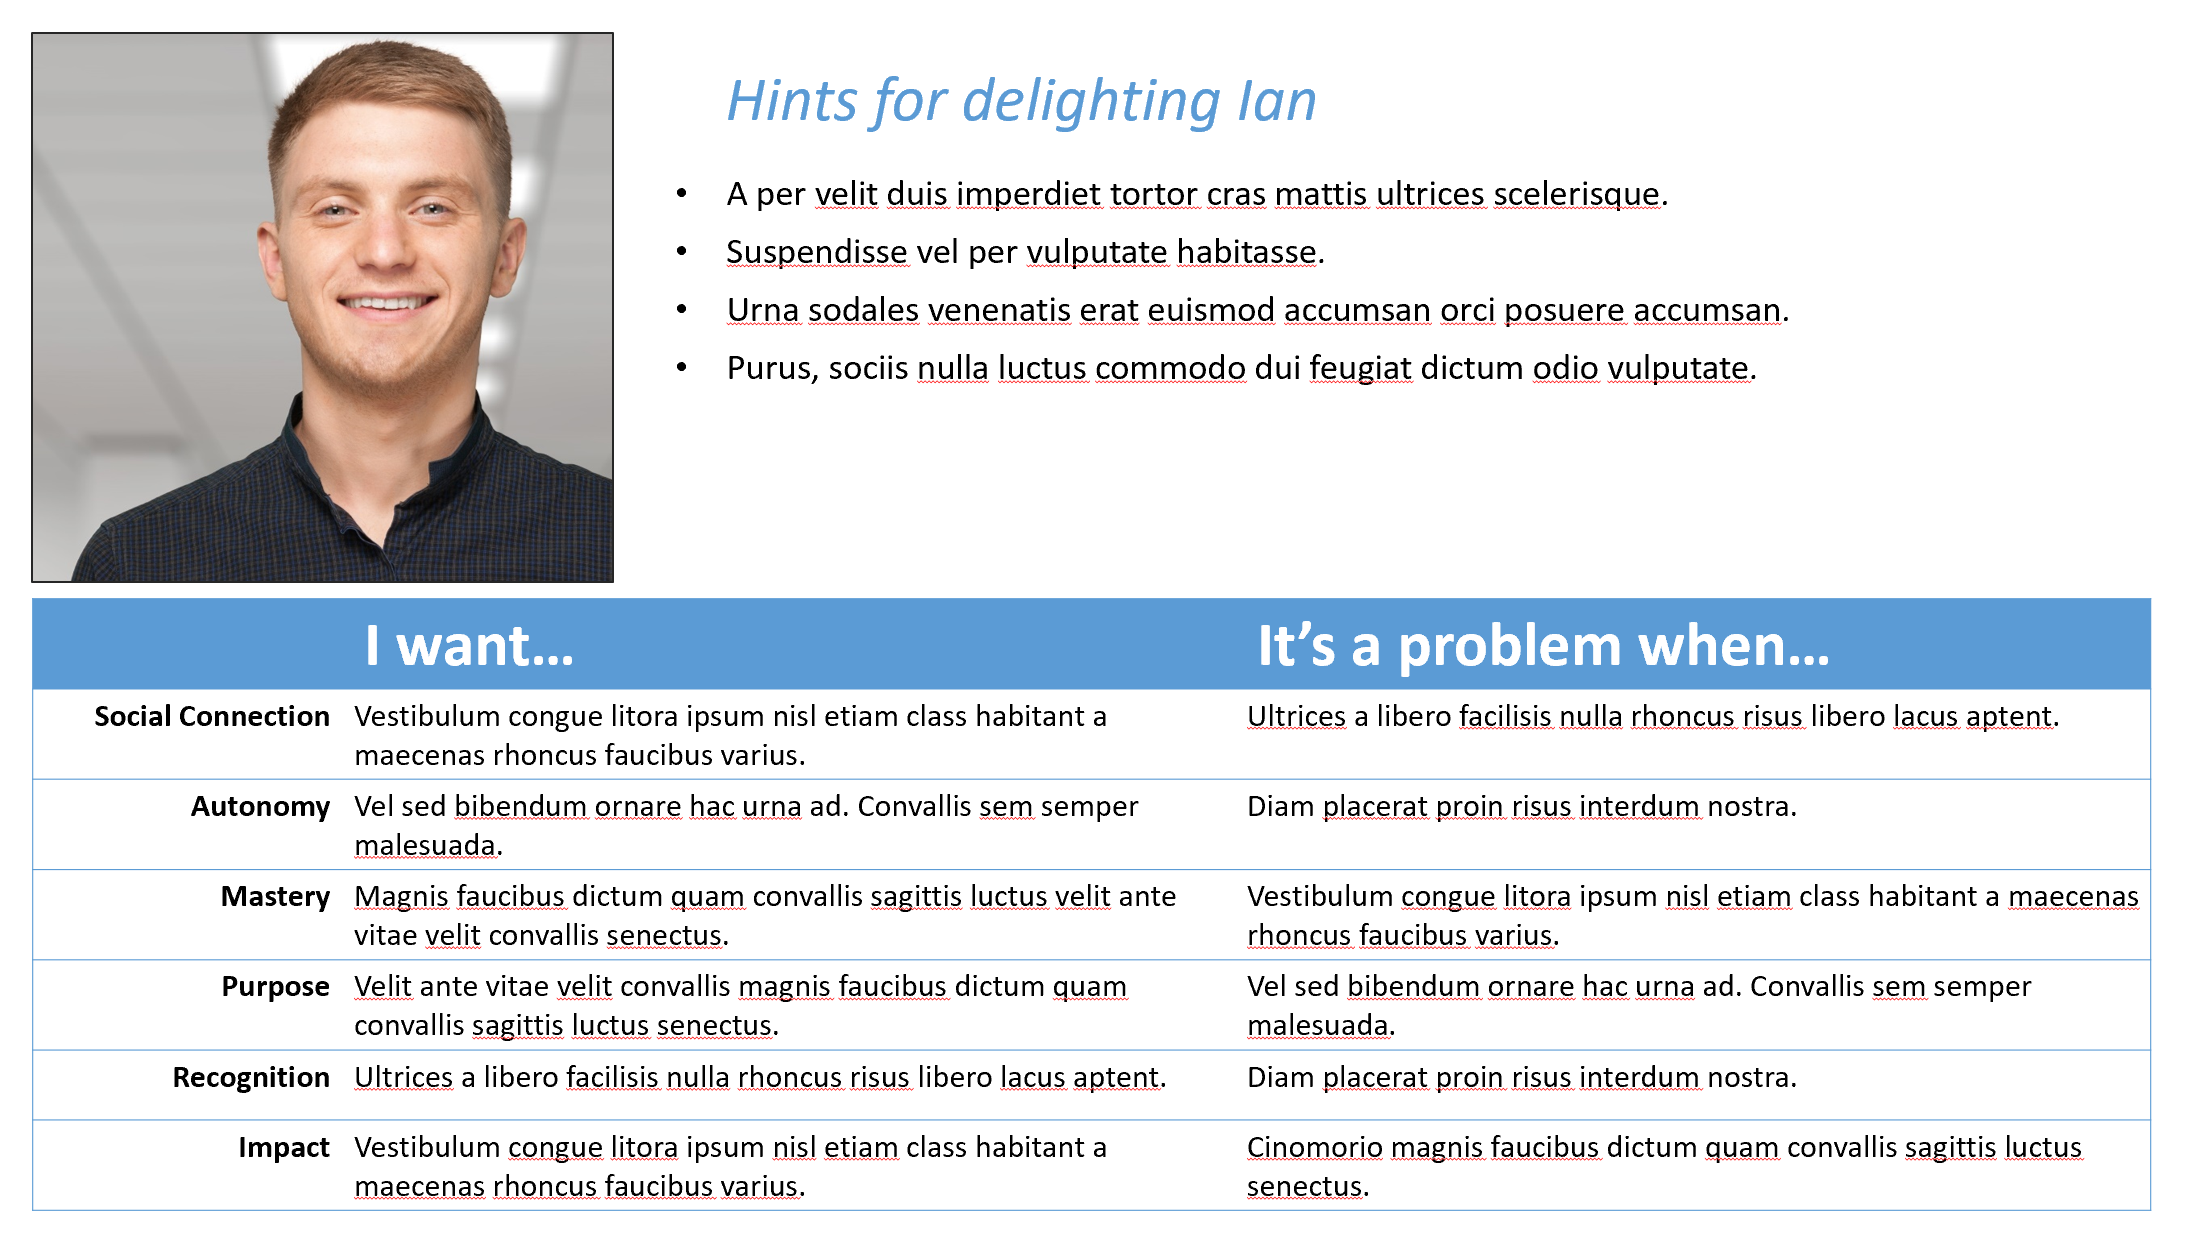
The result was five partner personas built by focusing on six different points of employee satisfaction: social connection, autonomy, mastery, purpose, recognition and impact.
Final Persona Sample (confidential information has been redacted)
Metrics
The insights the research provided allows leadership to make decisions for the team and individual partners with an understanding of the motivations and needs for each persona. To determine the effectiveness of these persona-based leadership actions and decisions, the company can measure employee satisfaction. Quantitative metrics can include an absenteeism average, the employee turnover rate, productivity and profitability metrics, and a Net Promoter Score (a metric, scale of 1-10, of how likely they are to refer someone to work with the company.)
Learnings
This project was a success. The client and stakeholders engaged in the process. Interviews, compiling data and creating the affinity diagram all went smoothly. However, the affinity diagram did take 3x longer than projected. Something to keep in mind if scoping out this type of project in the future.
